> ## Documentation Index
> Fetch the complete documentation index at: https://docs.taxibutler.com/llms.txt
> Use this file to discover all available pages before exploring further.
# Understanding & using the Dashboard page
> The Dashboard page provides key information about devices, locations and important stats.
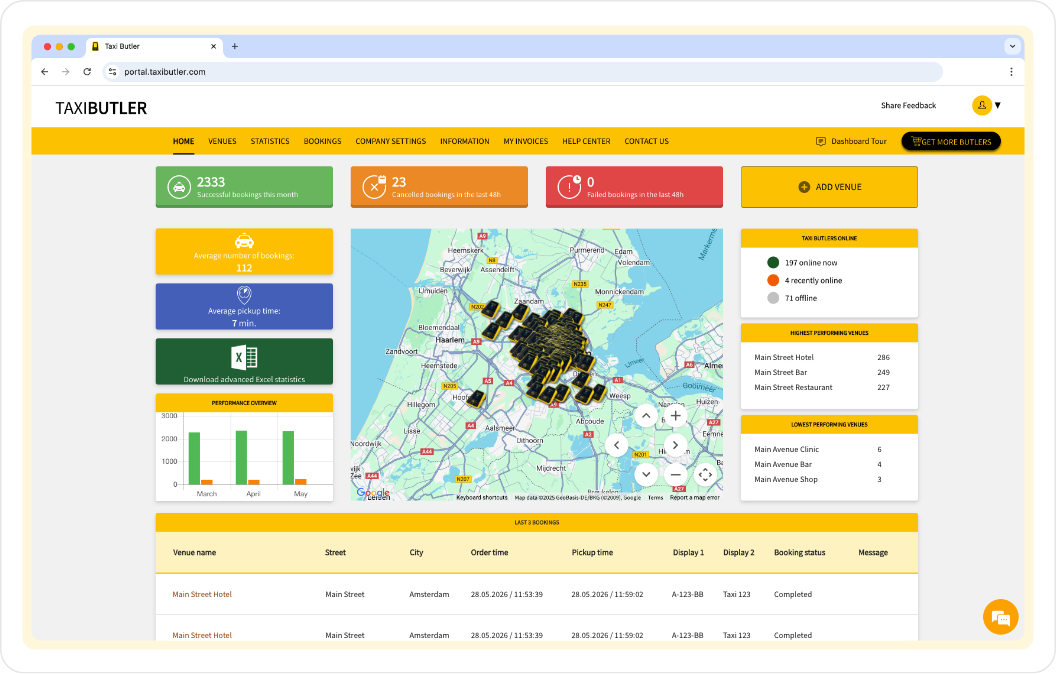 On the Dashboard, you can view important information at a glance, like:
* Successful bookings so far this month
* Cancelled bookings in the last 48 hours
* Failed bookings in the last 48 hours
* Average number of bookings
* Average pick-up time for your locations
* A chart showing the last 3 months of bookings
* Online, recently online and offline devices
* The top 3 and worst 3 performing locations
* The 3 most recent bookings
You also have a shortcut to quickly [add a new venue](/fleets/portal/venues/adding-a-venue) and a button to [download advanced statistics](/fleets/portal/download-statistics) in Excel format.
On the Dashboard, you can view important information at a glance, like:
* Successful bookings so far this month
* Cancelled bookings in the last 48 hours
* Failed bookings in the last 48 hours
* Average number of bookings
* Average pick-up time for your locations
* A chart showing the last 3 months of bookings
* Online, recently online and offline devices
* The top 3 and worst 3 performing locations
* The 3 most recent bookings
You also have a shortcut to quickly [add a new venue](/fleets/portal/venues/adding-a-venue) and a button to [download advanced statistics](/fleets/portal/download-statistics) in Excel format.